Multifamily Zoning Hotspots: Where to Invest in Austin’s Growth Corridors
Real Estate Education June 30, 2025
Real Estate Education June 30, 2025
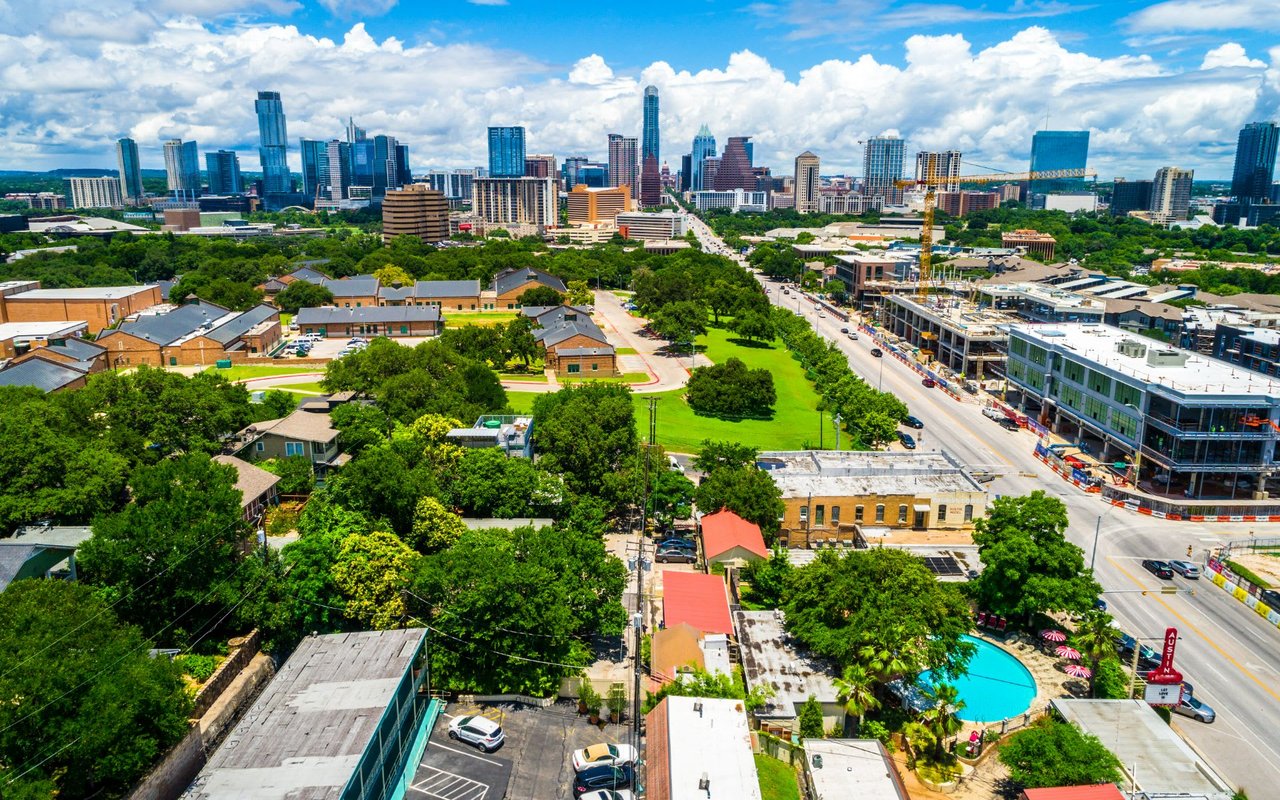
Austin’s explosive growth has reshaped the development landscape, especially for those with an eye toward multifamily investments. As one of the fastest-growing metros in the country, Austin faces immense pressure to accommodate new residents, leading to a pivotal shift in how the city approaches land use, zoning, and density. For serious investors and developers, this presents a rare opportunity, not just to follow growth, but to strategically align with it.
Multifamily development, whether through value-add rehabs or ground-up construction, now sits at the center of Austin’s long-term housing strategy. City-led initiatives like the HOME program, Affordability Unlocked, and VMU2 zoning overlays reflect a deliberate push toward higher-density, mixed-use, and transit-connected living. But navigating these opportunities requires not just enthusiasm but also a clear understanding of where zoning is loosening, where growth is concentrating, and where policy is actively shaping the future.
This guide explores Austin’s most promising multifamily zoning hotspots, dissecting corridor data, policy reforms, land use overlays, and market signals to equip developers and investors with the insight needed to make informed, future-ready moves.
Austin’s zoning framework is the foundation for understanding where and how multifamily development can thrive. From lower-density residential neighborhoods to high-capacity urban corridors, the city uses a tiered zoning system to guide what’s buildable, and where density can increase.
MF-1, MF-2, and MF-3 zones allow for medium-density residential development, with increasing levels of scale and intensity. MF-1 is the most restrictive, typically suited for townhomes or low-rise apartments, while MF-3 opens the door to denser and taller developments. These zones are common in transition areas between single-family neighborhoods and commercial corridors.
VMU (Vertical Mixed-Use) zoning represents a significant shift in land use philosophy, encouraging mid- to high-density residential combined with ground-floor commercial or office uses. Typically applied along Core Transit Corridors, VMU zones allow for greater height and FAR when projects meet affordability or design requirements. The recent VMU2 expansion pushes these benefits further, enabling even taller buildings in exchange for deeper affordability.
Austin’s pro-density momentum has accelerated through city-led initiatives aimed at tackling the housing crisis. The HOME Initiative (Phase 2), passed in 2024, allows for smaller lot sizes and more units on previously single-family parcels. It opened doors to multiplexes in areas that previously permitted only detached homes.
In parallel, targeted rezonings like the Zilker case, where a property was approved for 90-foot height under a modified density bonus after VMU2’s initial ordinance was invalidated, demonstrate how flexible density incentives are reshaping even affluent, historically restrictive neighborhoods.
Other neighborhoods under consideration or showing early signs of zoning evolution include Mueller, Hyde Park, Bouldin Creek, and Brentwood, where demand, transit access, and political will are converging to unlock new development possibilities.
Austin’s zoning system is layered with overlays and bonus programs that offer developers pathways to increase height, FAR, or units per lot, especially in return for affordable housing or public benefits.
Affordability Unlocked: Permits greater density, reduced setbacks, and waived parking minimums for projects that provide deeply affordable housing.
Downtown Density Bonus Program (DDBP): Enables increased entitlements in Downtown in exchange for community benefits and design quality.
VMU Overlay: Grants additional entitlements for mixed-use developments, typically along major transit corridors.
Neighborhood Plan (NP) Overlays: Add site-specific conditions based on local plans; important for determining compatibility and possible restrictions in gentrifying areas.
|
Zoning Type |
Max FAR |
Height Limit |
Unit Cap (typical) |
|
MF-1 |
0.6:1 |
35 ft |
~12 units/acre |
|
MF-2 |
0.6:1 |
40 ft |
~23 units/acre |
|
MF-3 |
1.0:1 |
40–50 ft |
~36 units/acre |
|
MF-4 |
1.0:1 |
60 ft |
~54 units/acre |
|
MF-5 |
1.0:1 |
60 ft |
High-density, >54 units/acre |
|
MF-6 |
Not specified |
90 ft |
Highest density, site-specific |
|
VMU / VMU2 |
Varies |
Up to 90+ ft |
No cap w/ bonus programs applied |
Understanding these designations and how overlays modify them is critical for evaluating any lot's development potential. When paired with Austin’s evolving policy landscape, they present a flexible toolkit for investors ready to meet demand with smart, scalable design.
Austin’s multifamily development is shaped by where people want to live, where infrastructure is expanding, and where policy is intentionally guiding growth. That’s where growth corridors come in. These are the city’s strategic focus areas for mobility, housing, and investment, offering investors a roadmap to future value.
Officially designated corridors, based on Austin’s Corridor Mobility and Construction Programs, include:
In addition, emerging corridors (those gaining traction due to local planning and developer interest) include:
Anderson Lane
South First Street
Springdale Road
Menchaca Road
I-35 Corridor (stretching into Kyle, Georgetown, and Leander)
These corridors often align with Core Transit Corridors and areas targeted in the Imagine Austin Comprehensive Plan, giving them both infrastructural support and long-term political backing for density and mixed-use development.
High-potential corridors typically check three boxes:
Transit Access: They’re located along current or future high-capacity transit lines, including routes identified under Project Connect, Austin’s multi-billion-dollar mobility initiative.
Existing or Planned Density: They are often already zoned for higher-density development or are targets for rezoning under programs like VMU2 or HOME.
Neighborhood Character: They balance urban appeal with livability—offering walkability, proximity to jobs, and cultural or commercial anchors.
In essence, these are the places where city-led investment and market-driven demand intersect.
Price gaps between for-sale and rental properties in these corridors highlight clear opportunities for long-term appreciation or cash flow. As of early 2025:
Austin Median Home Price: ~$575,000
Downtown Median: ~$733,000
West Oak Hill: ~$685,000
East Riverside Median: ~$460,000
Average Citywide Rent: ~$1,434/month
Bouldin Creek Rent Avg: ~$2,498
Downtown Austin Rent Avg: ~$3,051
This spread indicates that corridors like East Riverside or Burnet still hold significant value gaps compared to more mature urban cores, suggesting long-term appreciation for ground-up or value-add multifamily projects.
Infrastructure quality is another critical indicator of future demand. Many of the corridors listed above benefit from:
High walkability: Corridors like Burnet and South Congress offer pedestrian-oriented design and dense amenities.
Transit adjacency: Project Connect is bringing new light rail and rapid bus service to several of these corridors, raising land value and development interest.
Public investment: Corridor Construction Projects are already underway, with funding from Austin’s 2016 Mobility Bond, focused on improving sidewalks, drainage, bike lanes, and overall street safety.
Together, these elements make Austin’s growth corridors more than just development zones but as active conduits of economic growth, policy momentum, and livability. For developers, they represent the clearest path to scale multifamily investments aligned with the city’s long-term vision.
Austin’s multifamily development pipeline remains one of the most active in the nation, even amid shifting market conditions. For investors and developers, understanding where the volume is concentrated—and how it’s performing—is essential to assessing saturation risk, pricing strategy, and neighborhood momentum.
In the last two years, Austin has consistently ranked as a top market for multifamily permit issuance, particularly in projects with 5+ units. According to RealPage and Redfin data:
Austin issued 21 permits per 10,000 residents in 2024, down from its 2021–2023 average of 40, but still well above national norms.
The majority of permits are clustered in central and east side growth corridors, including East Riverside, North Lamar, and the South Congress/South First corridor.
Despite a recent cooling, this still reflects a strong long-term appetite for multifamily construction, particularly where zoning and transit align.
Several high-impact multifamily developments signal where the market is placing its long-term bets:
The Weaver (East Austin): A mixed-income, mid-rise apartment complex delivered under Affordability Unlocked provisions.
The Pearl (Burnet Road): A VMU-zoned, transit-adjacent property offering 300+ units with active ground-floor retail.
The Emma (South Congress): Boutique-scale infill apartments benefiting from HOME-adjacent zoning flexibility.
Mueller’s latest phase: New MF-4/MF-5 developments centered around walkability and commercial integration.
These projects illustrate how developers are leveraging zoning incentives, corridor visibility, and affordability programs to build smarter, not just bigger.
Vacancy rates are a key indicator of market stability, especially in high-growth zones. In Austin:
Overall vacancy reached 15.3% by Q4 2024, reflecting the influx of new supply in the pipeline.
Stabilized properties, however, report much stronger performance, with vacancy averaging 12.2% per Cushman & Wakefield, indicating healthy occupancy in well-located, matured assets.
Absorption has stayed relatively strong. In Q1 2025 alone, 4,800 units were absorbed, and over 33,000 square feet were leased in Q3 2024, showing that demand is still catching up to supply.
This divergence between new lease-ups and stabilized assets suggests that while overbuilding risk exists in certain submarkets, carefully positioned multifamily (especially near transit or in VMU zones) continues to perform. For developers, timing, location, and product type remain key levers to mitigate risk and maximize returns.
Austin’s development future is being actively rewritten—literally—through major zoning and policy reforms that are changing the rules for what can be built, where, and for whom. For multifamily investors, these changes aren’t just technical updates; they are signals of long-term opportunity and municipal alignment with housing-forward development.
At the center of this shift is the HOME (Home Options for Mobility and Equity) initiative, which has already completed two major phases. Phase 1, adopted in late 2023, revised long-standing limitations on occupancy and dwelling unit counts in single-family zones. Where a lot might have previously been limited to a single home, HOME Phase 1 opened the door to multiple units—think ADUs, triplexes, and fourplexes—in areas historically zoned for single-family only.
Phase 2, passed in May 2024, took the reform even further by reducing minimum lot sizes across large swaths of the city. This move allows developers to subdivide lots more efficiently and unlocks infill opportunities that were previously economically unviable. Height limits were also adjusted, giving builders more flexibility to work within smaller footprints. Together, these reforms have begun to erode the barrier between single-family and multifamily development, especially in urban-core and transitional neighborhoods.
Beyond HOME, momentum is building for a broader rewrite of Austin’s Land Development Code, a process long mired in legal and political challenges. But with growing public and political consensus around housing access and density, the climate is more favorable than ever. This rewrite could normalize many of the ad hoc entitlements currently granted through overlays or council vote, streamlining the path for multifamily developers seeking predictable outcomes.
Guiding all of this is the Austin Strategic Housing Blueprint, the city’s ambitious framework to address affordability and equitable growth. The plan sets a target of building 135,000 new housing units over a ten-year span, including 60,000 affordable units for households earning at or below 80% of the median family income. It also stresses distribution, ensuring that affordable units aren’t clustered only in low-income or historically underserved areas, but are integrated into high-opportunity, transit-connected neighborhoods.
This convergence of policy, planning, and political will marks a turning point. Investors who understand these shifts and move in sync with them aren’t just building units. They’re building on a city-backed platform for sustainable, inclusive growth.
Austin’s multifamily sector remains fundamentally attractive. But like any maturing market, today’s plays require sharper analysis, clearer timing, and a tolerance for navigating regulatory and political friction. For investors eyeing small to mid-size multifamily opportunities, both pricing and performance data suggest there is room for strategic entry, especially for those with a long-term or value-add outlook.
Cap rates for smaller multifamily properties in Austin have remained competitive, generally ranging between 5.0% and 6.5% depending on location, vintage, and tenancy. Stabilized assets in transit-accessible areas like East Riverside or South Congress lean toward the lower end of that range, while older properties in less walkable submarkets or those needing renovation offer slightly higher returns. Despite some compression from rising interest rates, demand for infill multifamily remains strong enough to support healthy pricing, particularly when affordability bonuses or density overlays are in play.
Sales data further confirms the value of strategic site selection. Teardown properties zoned MF-2 or MF-3 in core neighborhoods can command premium pricing when they fall within overlays like VMU or Affordability Unlocked, as developers see a clear path to higher FAR or unit counts. In contrast, entitled but underutilized land—particularly lots already cleared or with expired permits—can present faster turnaround opportunities, often with reduced entitlement risk.
Time on market remains relatively brisk for MF-zoned land within popular growth corridors. On average, well-positioned lots in zoning tiers MF-1 through MF-4 stay on the market for 45 to 90 days, though competitive pricing and entitlement clarity can cut that figure in half. Parcels with unresolved site constraints or lacking utility access tend to linger, but even those attract interest when paired with emerging transit infrastructure or recent upzoning trends.
Still, challenges persist. Neighborhood opposition (NIMBYism) remains a real force, especially in legacy neighborhoods with active contact teams or historic overlays. Even as policies shift in favor of density, public hearings can delay or derail otherwise viable projects. Permit timelines, too, are often unpredictable, particularly for projects needing variances or pushing the upper limits of height and density allowances. Infrastructure constraints, such as limited water or sewer capacity in fringe or older districts, can also introduce hidden costs or extended timelines if not addressed early in due diligence.
In short, the investment case for Austin multifamily remains solid but it increasingly rewards those who come in prepared: with entitlement knowledge, code fluency, and the patience to navigate complexity in exchange for long-term upside.
Austin is no longer a speculative frontier; it's a zoning-aware, policy-driven market where smart multifamily investments align directly with the city’s long-term growth strategy. From the sweeping reforms of the HOME Initiative to the density incentives embedded in VMU overlays and Affordability Unlocked, Austin is actively rewriting the rules to welcome more housing, especially along its key corridors and transit-connected zones.
For serious investors and developers, this creates a rare alignment between public policy, market demand, and long-term asset value. Whether targeting teardown sites, underutilized lots, or overlay-eligible parcels, the opportunity lies in reading the zoning landscape as both a blueprint and a signal, guiding not just what can be built, but where future growth will concentrate.
If you're considering a project in Austin or want to evaluate specific lots, now is the time to act. Request a custom zoning or feasibility review, or let’s build a curated site list based on your investment criteria, preferred yield targets, or development timeline. With the right strategy and support, the next phase of Austin’s multifamily market can be yours to lead.
Stay up to date on the latest real estate trends.

Your Guide to Buying Smart in Barton Hills, Zilker, and Westlake.
Brunch on Lake Austin or in Tarrytown’s Excellent Cafes.
Where Austin's Best Weather Meets Design That Lives Outside.
A Buyer's Guide to Reading the Details Beyond the Listing Photos.
Top Tips for Making Your Space a Standout.

Winning Strategies for Austin's Most Coveted Address.
Etiam non quam lacus suspendisse faucibus interdum. Orci ac auctor augue mauris augue neque. Bibendum at varius vel pharetra. Viverra orci sagittis eu volutpat.